With the American Astronomical Society getting ready to convene its 217th meeting in Seattle on the 9th, it seems fitting to talk about one of the most splendid ‘nearby’ stellar objects, the Andromeda Galaxy, otherwise known as M31. Edwin Hubble was the first astronomer to resolve individual stars in the galaxy, but working with Milton Humason, he did something even more significant, studying Cepheid variable stars inside it whose brightness varies in a regular pattern that indicates their absolute magnitude. These ‘standard candles’ made it possible to find M31’s distance, which Hubble showed was much greater than that of any stars in the Milky Way.
We were learning in Hubble’s day that the ‘spiral nebulae’ once thought to be part of our own galaxy were distant ‘island universes’ in their own right, a vast expansion of the size of the cosmos as humans understood it. M31 is the closest spiral galaxy to ours at roughly 2.5 million light years, offering up a spectacular view of as many as one trillion stars (according to 2006 Spitzer Space Telescope data). It’s also alive with star formation in ways that recent ESA images from both the Herschel and XMM-Newton space observatories are showing us.
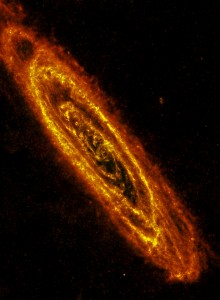
This is a new Andromeda, the image above being the Herschel view of the galaxy in the far-infrared, showing us clouds of dust and gas where stars can form. Moreover, the Herschel imagery shows not only a large ring of dust about 75,000 light years across that circles M31’s center, perhaps the result of a collision with another galaxy, but a number of other concentric rings of dust that will doubtless contribute to further star formation.
Image (above): This is the most detailed image of the Andromeda Galaxy ever taken at far-infrared wavelengths. The Herschel infrared space telescope captured the image during Christmas 2010. The large rings of dust that encircle the center of the galaxy may be the result of a smaller galaxy having collided with Andromeda some time in the past. Credits: ESA/Herschel/PACS/SPIRE/J. Fritz, U. Gent.
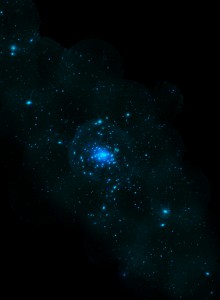
The contrast with the XMM-Newton data could not be more striking. XMM-Newton works with X-ray sources, and the imagery here is suggestive of stellar death as gas falls through space, heats up and gives off X-rays. Many of these X-ray sources are clustered around the center of the galaxy and indicate shockwaves and debris from exploded stars, or gaseous materials being sucked up by white dwarfs from stellar companions in what often ends up as a Type Ia supernova. In each case, we’re looking at wavelengths not visible from the surface of the Earth, images that tell us much about the living evolution of a massive city of stars.
Image: This image of the Andromeda Galaxy was taken by XMM-Newton during Christmas 2010. It shows hundreds of X-ray sources within Andromeda, many of them clustered around the centre, where the stars are densest. Each one is a dying star system. The sources can be shockwaves and debris rolling through space from exploded stars or pairs of stars locked in a gravitational fight to the death, in which one strips the other of precious gas. Credits: ESA/XMM-Newton/EPIC/W. Pietsch, MPE.
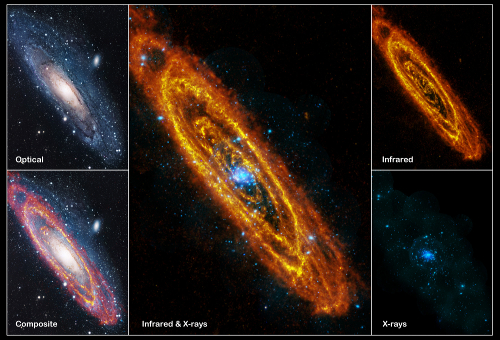
Below is a composite image showing views of M31 in various wavelengths for comparison.
Credit: Infrared: ESA/Herschel/PACS/SPIRE/J. Fritz, U. Gent; X-ray: ESA/XMM-Newton/EPIC/W. Pietsch, MPE; optical: R. Gendler.

The images of Andromeda are, well… Out Of This World!! I think I spent a good 1/2 hour on each one, just trying to comprehend the technology we have that has made such images. I’m stunned. My only complaint is your writing was too short … I wanted more! Thanks so very much!
Thanks for the beautiful composite picture of Andromeda in different wavelengths.
I have understood that Andromeda has a lower star formation rate than our own Milky Way galaxy, about 1 solar mass per year versus 3 – 5 solar mass per year for the MW. Also a lower supernova rate (about a third to half).
Is it possible from spectroanalysis of the entire Andromeda galaxy to estimate what the relative abundance of various spectral class stars is (F, G, K, M, etc.), plus maybe other parameters like metallicity and age of stars, so that we can compare this to our own MW?
ConnieM, you are most welcome! Like you, I’m totally absorbed by these images.
Ronald, good question re relative abundance of the stellar types — let me dig around a bit to see what’s been done on this score. But maybe one of our resident astronomers here can weigh in on this in the meantime.
Rather marvelously, those Andromeda images were prominently featured on Stargazing Live, a three-day stripped PRIME-TIME astronomy show on the BBC over here in Blighty. Proper BBC stuff- reality TV for geeks :-) This is what makes me glad that Rupert Murdoch doesn’t own all our media yet…
Ronald & Paul: I believe the stellar luminosity function is held to be universal. It might vary in special locations, but on galaxic scales it is constant. You would expect the stellar populations in M31 to have a very similar distribution to that of the MW, particularly since they are similar spiral galaxies.
It has to be this way or the Tully-Fisher relation wouldn’t work. Spiral galaxy luminosity plots tightly to the rotation velocity to the power of 4. There is said to be little scatter in the relationship, so little that errors in measurement are probably the main source of what scatter is observed.
So really you would expect M31 to be a good model of the MW, especially with the recent measurement of a higher V-rot of 250 km/s for the MW. This new V-rot should make the MW a similar luminosity to M31 via Tully-Fisher.
Thanks for the clarification, kzb. For those not familiar with it, here’s background on the Fully-Fisher relation:
http://en.wikipedia.org/wiki/Tully_Fisher
Paul et al, I think the article on Tully-Fisher on Scholarpedia is better:
http://www.scholarpedia.org/article/Tully-Fisher_relation
On the MW/M31 rotation velocity, see in particular Figure 7 in this article:
http://arxiv.org/PS_cache/arxiv/pdf/0902/0902.3913v2.pdf
The value of 250km/s for the MW has been contested by another paper based on the same data, but I’ll have to find that later if you are interested. That says 236km/s, still significantly larger than the standard 220km/s
Here is the article which questions the widely-publicised M J Reid et al determination of the MW circular velocity:
http://arxiv.org/PS_cache/arxiv/pdf/0907/0907.5423v2.pdf
The Reid et al determination was publicised as being largely assumption-free, therefore better than previous determinations. The paper linked above appears to cast a lot of doubt on that :) However it is notable that their central estimates are still greater than the standard velocity of 220km/s.