As announced yesterday at NASA Ames, the Kepler team has released the final Kepler catalog from the spacecraft’s first four years of data and its deep stare into Cygnus. The numbers still impress me despite our having watched them grow with each new report: We have 4034 planet candidates, of which 2335 have been verified as exoplanets. More than 30 of the approximately 50 near-Earth sized habitable zone candidates have been verified.
The new release brought us 219 new candidates, 10 of them habitable zone possibilities, giving us a final catalog that is our first take on the prevalence and characteristics of planets in the Milky Way, and paving the way for future space-based instruments as we look for targets for atmospheric characterization and direct imaging. By introducing simulated planet transit signals and adding known false signals, the researchers were able to tighten up the catalog, ensuring against errors in the analysis growing out of the team’s processing methods.
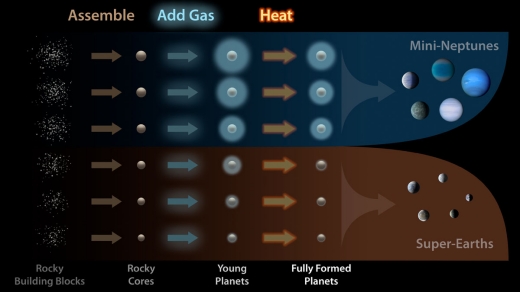
The Kepler data are also the subject of a new take on planetary demographics, as seen in the image below, which takes us into the realm of the kind of planets we do not see in our Solar System, so-called ‘mini-Neptunes’ ranging from 2 to 3.5 times the size of Earth.

Image: This diagram illustrates how planets are assembled and sorted into two distinct size classes. First, the rocky cores of planets are formed from smaller pieces. Then, the gravity of the planets attracts hydrogen and helium gas. Finally, the planets are “baked” by the starlight and lose some gas. At a certain mass threshold, planets retain the gas and become gaseous mini-Neptunes; below this threshold, the planets lose all their gas, becoming rocky super-Earths. Credit: NASA/Kepler/Caltech (R. Hurt).
A research group working under Andrew Howard (Caltech) has drilled deep into the dataset, measuring the size of 1300 stars in the Kepler field of view to determine the radii of 2025 Kepler planets with four times more precision than had previously been achieved. Out of this work on planetary sizes comes the finding that these planets can be classified into two distinct groups: Rocky Earth-like planets and mini-Neptunes. From the paper:
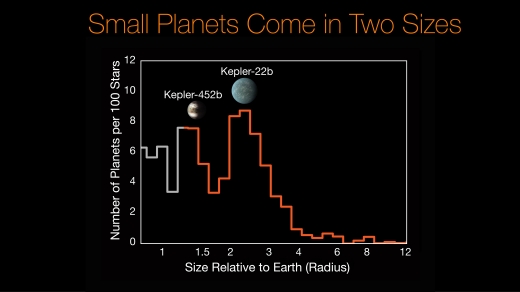
We find evidence for a bimodal distribution of small planet sizes. Sub-Neptunes and super-Earths appear to be two distinct planet classes. Planets tend to prefer radii of either ?1.3 R? or ?2.4 R?, with relatively few planets having radii of 1.5–2.0 R?. Planets in the gap have the maximum size for a rocky core, as seen in previous studies of bulk planet density and of ultra-short period planets. We posit that the bimodal planet radius distribution stems from differences in the envelope masses of small planets. While our current dataset is insufficient to distinguish between theoretical models that produce the gap, it charts a path forward to unraveling further details of the properties of the galaxy’s most abundant planets.
Although most of the Kepler planets have proven to be between the size of the Earth and Neptune, the planets were previously thought to span the range between the two rather than to fall into distinct groupings. Erik Petigura (Caltech) is a co-author of the new study, which will appear in The Astronomical Journal, along with two other papers that make up an observational program known as the California-Kepler Survey (see citations below):
“In the solar system, there are no planets with sizes between Earth and Neptune. One of the great surprises from Kepler is that nearly every star has at least one planet larger than Earth but smaller than Neptune. We’d really like to know what these mysterious planets are like and why we don’t have them in our own solar system.”

Image: Researchers using data from the W. M. Keck Observatory and NASA’s Kepler mission have discovered a gap in the distribution of planet sizes, indicating that most planets discovered by Kepler so far fall into two distinct size classes: the rocky Earths and super-Earths (similar to Kepler-452b), and the mini-Neptunes (similar to Kepler-22b). This histogram shows the number of planets per 100 stars as a function of planet size relative to Earth. Credit: NASA/Ames/Caltech/University of Hawaii (B. J. Fulton).
The Keck work involved researchers at UC Berkeley, Harvard, the University of Hawaii, Princeton and the University of Montreal as well as Caltech, a multi-year project analyzing the Kepler spectral data to obtain precise measurements of the host stars, which then allowed the scientists to refine the sizes of the planets orbiting those stars. Why the planets exist in two distinct groups — with a clear gap between rocky Earths and mini-Neptunes — remains problematic. Are Earth-sized planets the norm, with some of them simply obtaining enough of a gas envelope to become mini-Neptunes? Andrew Howard comments:
“A little bit of hydrogen and helium gas goes a very long way. So, if a planet acquires only 1 percent of hydrogen and helium in mass, that’s enough to jump the gap. These planets are like rocks with big balloons of gas around them. The hydrogen and helium that’s in the balloon doesn’t really contribute to the mass of the system as a whole, but it contributes to the volume in a tremendous way, making the planets a lot bigger in size.”
On the other hand, the researchers speculate, it may be that planets without enough of a gas envelope to fall into the gap can lose gas because of radiation from the host star. In this scenario, planets that wind up in the gap aren’t likely to stay there for long, producing thin atmospheres that are quickly blown off. Either scenario produces the populations we see in the new data, but we’ll need to learn more about the composition of mini-Neptunes to get a picture of why they seem to form so easily around other stars but not around our Sun.
The paper adds this:
…making a planet with a thin atmosphere requires a finely tuned amount of H/He. Second, photoevaporating a planet’s envelope significantly changes its size. Our observation of two peaks in the planet size distribution is consistent with super-Earths being rocky planets with atmospheres that contribute negligibly to their size, while sub-Neptunes are planets that retain envelopes with mass fractions of a few percent.
Three papers from the California-Kepler Survey are now available on the arXiv site in preprint form, all of them accepted for publication at The Astronomical Journal: Petigura et al., “The California-Kepler Survey. I. High Resolution Spectroscopy of 1305 Stars Hosting Kepler Transiting Planets” (preprint); Johnson et al., “The California-Kepler Survey. II. Precise Physical Properties of 2025 Kepler Planets and Their Host Stars” (preprint); and Fulton et al., “The California-Kepler Survey. III. A Gap in the Radius Distribution of Small Planets” (preprint).


Isn’t there a bias here because most planets detected were orbiting red dwarfs? Bigger stars would have stronger winds during formation, which could significantly blow away gas accretion in planets.
Daniel,
No, I checked the Kepler data, and of all the confirmed and candidate planets (over 4500) just over 60% orbit solar type (5000-6300 K, roughly F7-K2) stars.
This is not because solar type stars have a greater abundance of planets (as far as we know), but because the Kepler sample (input catalogue) has a relatively large fraction of those solar type stars.
To give some idea of what just 1% atmosphere means, in Earth’s case it’d mean a surface pressure of about 12,000 bars. In such conditions the crust is unlikely to have solidified in the present age of the solar system.
DIIRC, didn’t Andrew Le Page state that he thought the cutoff was 1.6 Earth masses? If so, that was right in the trough separating the 2 planetary types.
Alex, no, the cutoff was 1.6 Re, not Me.
So closer to 4 Me? This implies Re -> 2.35 – 2.8 Re. That would put it beyond the 2nd peak, and suggests it is too large.
The 1.6 Earth radii cutoff is originally from this paper by Leslie A. Rogers.
A lot of Bayesian statistics got Rogers an answer that appears to be empirically verified with more data showing a strong, bimodal distribution with a trough at close to his cutoff point.
Alex, according to the work by Leslie Rogers which I have often quoted, the point where there would be a 50-50 split in the population between rocky and volatile-rich planets occurs at a radius of no greater than 1.6 RE but more likely around 1.5 RE. Assuming an Earth-like composition those radius values correspond to masses of ~6 and ~4.7 ME.
Andrew, can you walk me through the thinking about what happens when you walk down the radii from Neptune-type planets?
As Neptune has a much lower density, at 1.5 Re, the mass would be approx 1.0 Me with a density of 1.64. In reality, I doubt that that density operates, nor that at that mass the large gas envelope is possible. I haven’t done the calcs, but a Neptune type planet needs a mix of higher g and lower temperature. Therefore I suspect the 1.5 Re transition is truly rarer as the data suggests as that is not a very stable state for a planet at that radius in those relatively close orbits. Either they stay as a mostly rocky world with a relatively thin atmosphere, or the radius rapidly increases as a large gas envelope is retained.
The Gap only has ONE theoretical explanation?
Since the chart does not include Habitable Zone information,
it would be nice to include that, to give the hypothesis a bit more foundation.
This is pretty important, as if there is one GAP, there could be ANOTHER where we really are blind.
Of course Kepler was not sensitive enough to settle the question of
the frequency of .8 RE to 1.2 RE worlds in the habitable ZONE of stars similar to our Sun. Many Studying the Kepler data state that they are NUMEROUS, but we just cant see them. but as a niggling doubt, let me point to the known tidbit below.
To date only one world 186F discovered by Kepler, could be said to be close to Earth sized and in habitable ZONE, but it should get an Asterisk, because it is Red Dwarf, albeit a rather hot one. This is pretty paltry for a survey of 150,000 stars, with and average of 1,700 of them aligned for transit detection. So there maybe up to a hundred or so of these 186F type worlds
on red suns we that are not aligned with Earth. And that is all that we can say with actual data to interpolate (not that having one data poing ,186F, is so great either)
With ref. to the suspected and feared drop-off of terrestrial planets in wider orbits, I may have some encouraging facts;
I have checked the entire updated Kepler database of all confirmed and candidate planets (experience has shown that about 90% of candidates turn out to be real planets) and I have done some analysis myself.
Let me emphasize that I am fully aware that the transit method is extremely biased against wider orbits (which is precisely there *seem* to be so few planets in wider orbits). However, the great thing about this method, contrary to the radial velocity method, is that there is relatively little bias with regard to planet size (beyond a minimum threshold of course), and as far as there is, it is against small planets resulting is a slight underestimate for those.
So, while it is not sensible to compare planet occurrence in various orbital periods (at least not without significant correction, something which I will not dare here), it is quite feasible to compare the relative occurrence of various planet size classes *within the same orbital period (AU)*.
I have done that and I found a few interesting things:
1) Of all planets (about 4500) some 33% are terrestrial planets (R 0.7 – 1.6 Re). For solar type stars (roughly F7 – K2) the fraction is remarkably similar, about 35%.
2) Of all planets in the HZ about 22% are terrestrial, for solar type stars this fraction is about 25%.
3) But it gets better: when we consider terrestrial planets as a fraction of all planets *per orbital bin (AU)*, we find that beyond about 0.2 AU, this fraction does not diminish significantly up to about 1.3 AU.
Concretely: from 0.2 AU up to 1.3 AU, when subdivided in 0.1 AU orbital bins, the fraction of terrestrial planets (of all planets) varies from 6 – 20 % (average 13 %), with no drop-off toward wider orbits within this AU range.
For solar type stars the average fraction of terrestrial planets of all planets from 0.2 to 1.3 AU is 16% (range for 0.1 AU bins is from 0 – 37 %, probably due to smaller sample sizes, from 0.2 – 0,7 AU the range is 8 – 12 %), again with no drop-off toward wider orbits.
I find this quite hopeful and encouraging.
There are actually TWO “deserts”, the 1.76Re-1.99Re Super Earth-Mini Neptune “transition zone” AND the 1.1Re-1.23Re Earth-Super Earth “transition zone”, which Kipping and Chen argue IS the REAL transition to Mini-Neptune zone. The FINAL answer will come when ESPRESSO comes on-line and starts determining the MASSES of the sparse number of planets in BOTH “transition zones”. P.S.: LHS 1140b MAY be an EARLY INDICATOR of WHICH WAY this will go!
Good point, the 1.1 to 1.23 must be the advanced Klingon civilizations that are clocking their planet and the 1.76-1.99 are the old Dracon civilizations :-}
From taking a quick peruse of the papers, I would say there is a deficiency of Red Dwarfs in the sample, which cuts off below K5 (4700 deg C). Also, the thermal environment that these planets are in is hot. It ranges from 10 to 3000 times Earth’s insolation.
What he papers do tend to confirm is that below a certain mass (about 2 1/2 times that of Earth) planets can’t hold onto a substantial H, He atmosphere.
What would be interesting is a similar survey for Red Dwarfs to see if there is the same distribution. I can see two main factors affecting the distribution: 1) the thermal environment would be less intense, and 2) The mass of a body formed appears to be in proportion to its primary, so, on average, the planetary size would be smaller with red dwarfs. I would expect the same sort of bimodal distribution, but the gap may be at a different value.
In light of this final data release, what are the updated figures/estimates for planet frequency (fp in the Drake equation) and habitable planet frequency (fne in the Drake equation? Did the Kepler team compute estimates or are they leaving that part up to the wider exoplanet community?
How lovely it is to have sufficient data to actually characterize a distribution! Only a few years ago, one could never begin a statement like this: “Most planets…”
Sweet times indeed.
Would the Earth have been a mini-Neptune without the impact that created the Moon? Could this be why the Solar System doesn’t have a mini-Neptune?
It would be interesting to learn whether this planetary size gap also exists for small planets in wider orbits. I would expect so: the mass threshold and runaway gas accumulation will also occur there. However, the quick loss of gas of small planets in the gap (by stellar radiation) would not occur as quickly in wider orbits.
To begin with, it would be interesting to relate this planet size distribution to orbital size (AU) distribution.
The planet size distribution diagram above also shows a striking paucity of giant planets.
Now, I realize that the Kepler detections are strongly biased towards smaller orbits, so we cannot say anything conclusive about the occurrence of giant planets in wider orbits.
But it might be so that the occurrence of mini-Neptunes and Neptunes in inner systems, as these are so frequently found, correlates negatively with the occurrence of giant planets. In other words, the absence of medium-sized (mini-Neptune, Neptune) planets in our inner solar system may be because of the presence of our giant planet Jupiter.
> The new release brought us 219 new candidates, 10 of them habitable zone possibilities
For readers interested in my analysis of the potential habitability of these ten Kepler planet candidates, feel free to check out my latest review:
http://www.drewexmachina.com/2017/06/22/habitable-planet-reality-check-keplers-new-planet-candidates/
Could there be a selection effect involving the different ways of detecting planets. Are smaller ones more likely to be detected by transit and larger ones by wobble? This might trick out the statistics.
While you are correct to assume there are different selection effects connected with different techniques this doesn’t really apply here as these results are about the huge treasure-trove of the Kepler data and that data involves only transits… of all sized planets (hence the radii can be constrained so accurately). Of course, the Kepler data only includes orbits out to a certain distance so longer period planets are absent from the data for Sun like stars for example. And this is only a prelimanary assessment, not the last word on it.
I wonder if one of the gaps, 1.6 Er is due to the accretion process where U.V radiation is created from collisional impacts (its massive enough) driving away hydrogen/helium before it can be accreted.