A ‘hot Saturn’ with a difference, that’s WASP-127b. Although it’s 525 light years away, we’ve learned a surprising amount about the planet’s atmosphere. Details come via the ongoing Europlanet Science Congress 2021, now being held virtually for pandemic reasons, at which Romain Allart (iREx/Université de Montréal and Université de Genève) spoke this week.
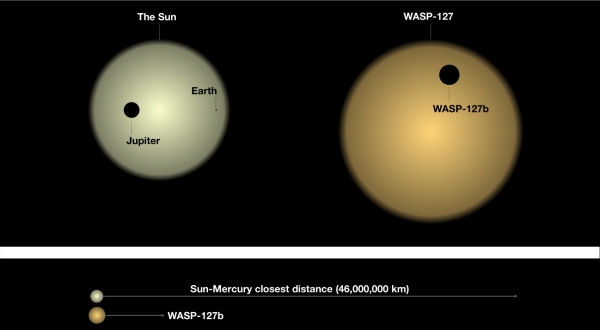
WASP-127b is quite an unusual planet with or without cloud cover. It’s orbiting its star in a scant four days, amped up by stellar irradiation levels 600 times what the Earth receives from the Sun. That would, the researcher points out, produce temperatures in the range of 1100 degrees Celsius (over 1370 Kelvin). The result of all these factors is a world with a fifth the mass of Jupiter actually inflating into a radius 1.3 larger than Jupiter. The word in vogue among astrophysicists for a planet like this seems to be ‘fluffy,’ which pretty much describes it.

Image: WASP-127b compared with planets of our Solar System. Credits: David Ehrenreich/Université de Genève, Romain Allart/Université de Montréal.
The work on WASP-127b’s atmosphere involves infrared observations from Hubble combined with data from the extraordinary ESPRESSO spectrograph at the European Southern Observatory’s Very Large Telescope in Chile. The method at the VLT is transmission spectroscopy, analyzing the light of the star during a transit as it passes through the planet’s atmosphere. Allart pointed out to the virtual Europlanet Science Congress attendees that surprises were in store:
“First, as found before in this type of planet, we detected the presence of sodium, but at a much lower altitude than we were expecting. Second, there were strong water vapour signals in the infrared but none at all at visible wavelengths. This implies that water-vapour at lower levels is being screened by clouds that are opaque at visible wavelengths but transparent in the infrared. We don’t yet know the composition of the clouds, except that they are not composed of water droplets like on Earth. We are also puzzled about why the sodium is found in an unexpected place on this planet. Future studies will help us understand not only more about the atmospheric structure, but about WASP-127b, which is proving to be a fascinating place.”
The zone within the atmosphere that the scientists were able to probe with their combined datasets proved to be clouds in an atmospheric layer with a pressure ranging between 0.3 and 0.5 millibars. We also know that this is a planet in a retrograde orbit, something Allart says is unexpected for a hot Saturn in a stellar system that is thought to be a whopping 10 billion years old. If things have not settled down by this time (and the planet orbits as well in a different plane than equatorial), it may point to the presence of an unseen planetary companion.
Is planetary migration a possibility here? From the paper:
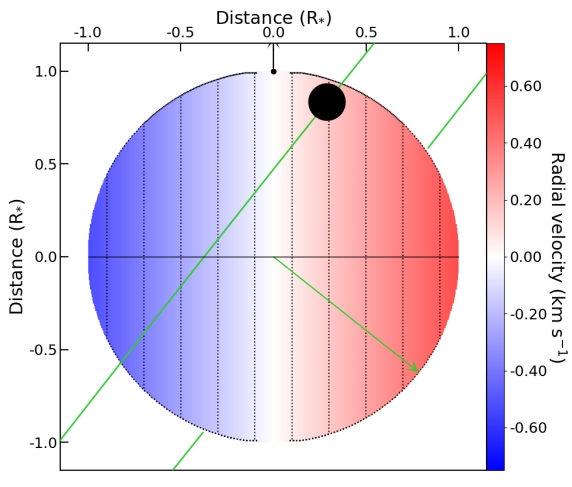
Our best-fit model shows that the old star WASP-127 is a slow rotator while its planet has a misaligned retrograde orbit (a view of the system is represented in Fig. 4). We also note that the WASP-127 system does not fit in the known dichotomy of hot exoplanets. Winn et al. (2010); Albrecht et al. (2012) have reported that stars with Teff below 6250 K have aligned systems which is not the case of WASP-127b (Teff = 5842 ± 14 K). One possible scenario is that WASP-127b remained trapped in a Kozai resonance with an outer companion for billions of years, and only recently migrated close to its star (see e.g. the case of GJ436b, Bourrier et al. (2018)). An in depth analysis of the system dynamic is beyond the scope of the present study.

Image: This is Figure 4 from the paper. Caption: Fig. 4: View of the star planet system at the ingress transit. The stellar disk velocity has a color gradient from blue to red for negative to positive stellar surface velocity. The stellar rotation axis is shown as the black top arrow. The planet is represented by the black disk and occults first the red part of the star and then the blue part, following its misaligned orbit shown in green. The green arrow represents the orbital axis. Credit: Allart et al.
So we’ve reached the point where we can tell the difference between cloudy worlds and their cloud-free counterparts by measuring water content, acquiring data that also reveals the pressure of the cloud deck from which the measurements are taken. It’s early days in this kind of analysis, but we can assume that these methods will work their way into future surveys on planetary atmospheres. Understanding atmospheric structure and composition is a path into the formation history and evolution of any exoplanets. Beginning with planets in extreme conditions, we can look forward to future surveys as these techniques are applied to smaller worlds.
The paper is Allart et al., “WASP-127b: a misaligned planet with a partly cloudy atmosphere and tenuous sodium signature seen by ESPRESSO,” Astronomy & Astrophysics Vol. 644 (December, 2020), A155 (abstract / preprint).


I am wondering about the night side temperature of Wasp 127b is? If hot gas giants are hot enough the night side should be a black body radiator and should have an emission spectrum from it’s night side, i.e., glowing in the invisible, black body thermal infra red? It would also on the night side have an absorption spectrum in the lower atmosphere from the hotter upper atmospheric emission ?
The shadow side of the planet might very well be glowing in the thermal IR, but the signal would be swamped by the same radiation from the star’s photosphere. The net loss of stellar emission due to the transit would not be made up for by the addition of the relatively fainter planetary night-side glow.
But at the peak frequencies of the black-body curve (somewhere in the visual range), the flux differences from the two bodies would be much more detectable.
Henry Cordova, I was referring to the idea that the lower atmosphere of the hot Jupiter could be warmer than the top part of the atmosphere on the night side. Consequently, the lower part would be a black body radiator and cause and absorption spectrum in the top part of the atmosphere. The light also goes through the atmosphere of the exoplanet during it’s eclipse in front of the star with transmission spectroscopy. The spectra of the star and planet can be differentiated because the star light plus planet light can be subtracted by the star light alone when the planet goes out of sight behind the star during the secondary eclipse. This also applies to light passing through the planet on the limb or terminator and includes the depth of the atmosphere from the thinner top to the bottom which includes both scattering and absorption spectra. This should also include the night side black body thermal infra red. Whether one could see absorption features at the top of the atmosphere due to a hotter lower atmosphere as a black body radiator I don’t know. There is no worry about the signal being swamped due to the light subtraction technique of transit spectroscopy, using the primary and secondary eclipse.
Just before the primary transit shouldn’t the thermal infra red signature of the planets night side also be visible if is a hot on the night side.
“Just before the primary transit shouldn’t the thermal infra red signature of the planets night side also be visible if is a hot on the night side.”
It might be possible in principle, but I suspect it would not be so in practice. Although the star is a black body radiator, just like the planet, it is much hotter. I suspect the black-body peak IR emission for the planet would still be much less than the stellar emission AT THAT SAME FREQUENCY, In transit, there would be a dip in the light curve at that frequency but this would only be a tiny part of the total light emitted by the entire system. The difference would be much less than the total difference subtracted by the eclipse.
I get the impressions these transits are barely observable even when the entire light from the star is partially obscured by the planet’s disc. If you are only considering that IR signature, I suspect it would be lost in the noise. As for your comments about whether absorption lines might be observable, that may very well be true, although I don’t know that for a fact.
It’s not just the brightness or intensity of the light, but also the spectra which allow us to differentiate the spectra of the star from the planet. Red dwarfs have ionized metals which show in their spectra and hot Jupiter’s don’t. This is beside my point though which was the idea that the lower part of the night side atmosphere itself can in potential be a black body radiator if it is hotter than the upper night atmosphere. If so, then there should be absorption lines caused by the lower night side atmosphere which is not directly heated by star light from the day side of the atmosphere. I got the idea from Sara Seager’s book: Exoplanet Atmospheres. P. 106. There should be an absorption spectrum at the top of the atmosphere from each lower, thicker layer. I was wondering if we can see that from Earth in a exoplanet hot Jupiter.
We already know what the absorption spectra of red dwarfs stars is which is different than hot Jupiters, so we can differentiate them with the primary and secondary eclipse in transit spectroscopy.
Can someone explain why the planet is in a retrograde orbit?
From the image, the star is rotating clockwise – the red hemisphere approaching us and the blue receding. The planet crosses the star’s face from right to left – in the same direction as the star’s rotation. Isn’t this prograde (even if the orbit is misaligned with the star’s axis of rotation)?
The astronomical convention is that velocities in recession are positive, those in approach are negative. So the expanding universe is red-shifted, and the RVs are positive.
You can think of the radial velocity as the derivative of the distance function w.r.t. time. If the distance is increasing, its derivative is greater than zero.
Astronomers love to do this sort of thing. Have you noticed that on the H-R diagram the hotter stellar temperatures are to the left, the cooler ones are to the right? And the higher magnitudes (fainter) are towards the bottom and the lower ones (brighter) are towards the top?
As usual, there are reasons of “tradition” always invoked to justify these anomalies.
Greetings, Mr Cordova,
Oh gosh, after what you wrote , I’m puzzled whether my explanation to Mr Tolley is entirely correct.
I was sure that when I looked at star catalogues decades ago, the convention was positive stellar radial velocity for approaching stars, and that would fit with your comment that astronomers seem to do things back to front (which is very true). I thought I had a memory of being irritated by this backwards convention.
However, I see that your first paragraph, while opposite to that, is indeed true. For example, the Wikipedia page for Alpha Centauri shows a negative stellar radial velocity and it is approaching us.
I’m sure Doppler radar has the opposite convention: positive for approaching.
Now I wonder, did the astronomical convention change, or my memory of it?
I thought a retrograde orbit was one where the planet orbits in the opposite direction to the rotation of the primary.
Retrograde and prograde motion
If the color is meant to indicate shift, then the red hemisphere is receding and the blue is approaching. This would give us a retrograde orbit for the planet.
Greetings, Mr Tolley,
the star WASP-127 is rotating in the other sense than you think, so WASP-127b’s orbit is indeed retrograde.
The red side is representing redshift, so recedes from us, vice versa for the blue side.
I suspect you thought the opposite as the radial velocity is positive for redshift, here. This is opposite to the astrnomical convention, so I can understand your confusion.
However, I have to say that I have always been irritated by that astronomical convention (that a positive radial velocity indicates a star is approaching us) as if we are supposed to define velocity as the first time derivative of distance, than increasing distance should derive a positive rate of change.
I think the origin of this is from the Doppler effect, especially in radar, where an approaching target causes a Doppler shift in frequency to a higher frequency, hence a ‘positive’ differential change.
Thanks. So the blue with a negative radial velocity is coming towards us and the red is receding.
There was/is a similar problem in genomics biology whereby someone’s early decision that upregulated genes on microarrays were red, and downregulated were green, contrary to expectation. (This is due to the colored markers used where the controls were green and therefore the two states – expt and control on the same spot would show upregulation if the expt sample had more red marker than the control.) There wasn’t any need for it to be this way, just a decision was made on early microarrays that continued.
… and now you see that the planet is indeed retrograde!
I find that these ‘backwards’ definitions are surprisingly plentiful, Mr Tolley. I did not know about the genomics one, but I’ve found there are even more fundamental ones that are seemingly backwards. There’s a maths one that got me: sine and cosine. I felt those should be the other way around as the cosine seems more ‘fundamental’ being the ratio of x to r, as opposed to y to r. I mean, it’s (x,y), not (y,x), so x-axis first …
And we all know about electron charge. Obligatory xkcd: https://xkcd.com/567/. (Though I find this ‘backwards’ definition oddly helpful in comprehending positive hole currents in doped semiconductors.)
The definition of sine is much older than Cartesian coordinates, and it was the fundamental concept for the mathematicians of that time because the sine is “half a cord” of a “circunference arc”. The cosine was simply the sine of the complementary arc, thus co-sine. See:
https://en.wikipedia.org/wiki/Jy%C4%81,_koti-jy%C4%81_and_utkrama-jy%C4%81
Heh! Thanks for the link, Antonio, because it shows I was told something not true in the maths lesson that puzzled me over the order of sine and cosine when I was 11. We had already been taught about Cartesian co-ordinates and the ‘primacy’ of the x-axis, and it was now time for trigonometric functions. The teacher told us that ‘sine’ came from ‘sinus’, meaning ‘bay’ in Latin, because (he said) the sine curve looked like a series of bays.
Your link shows that’s not actually true! It says sinus also meant ‘bosom’, which was a Latin translator’s interpretation of an Arabic word for the Sanskrit term.
From the source of all wisdom (the Wikipedia entry for “radial velocity”:
“That is, the radial velocity is the component of the object’s velocity that points in the direction of the radius connecting the point and the object. In astronomy, the point is usually taken to be the observer on Earth, so the radial velocity then denotes the speed with which the object moves away from the Earth (or approaches it, for a negative radial velocity).”
https://en.wikipedia.org/wiki/Radial_velocity
Also, in the listing legend for the RV column in Vol 1 of Sky Catalogue 2000 2nd ed (1991):
“RV – Radial velocity in km/sec. Positive means receding (traveling away from the solar system).”
My oldest catalog is the Becvar Atlas of the Heavens II (1964), which has the same convention (away = positive) Perhaps in the distant past, the convention was reversed.
The way to keep this straight is to remember that velocity is the derivative with respect to time of distance. So if the distance to an object is increasing, the derivative of the distance is positive.
Thanks Mr Cordova!
Thinking it over, I now believe Mr Tolley’s initial confusion made my memory unfairly pick on astronomy. I suspect astronomy always had it right. My irritation must actually have been with the radar convention that approaching targets have positive Doppler velocity.
While we’re on the topic, it might be instructive to recall why the x-axis of the H-R diagram is flipped left to right.
The x-axis is marked either as stellar spectral class, surface temperature, or color index. This last quantity is the difference in magnitude between the star’s image on a blue-sensitive photographic plate and a red-sensitive one. This odd parameter was chosen because it is pretty much independent of the length of the exposure, the type of emulsion employed or the optical characteristics of the telescope.
Once the plate/telescope combination was calibrated by noting how the images of a reference star (whose color had been determined previously using some other method) were affected, it was possible to immediately determine the color index of EVERY star on the plate. Nowadays, with other detectors available, it isn’t necessary to do this, but there’s a lot of archive stellar data still out there, so the practice lingers.
But in the H-R diagram, it means the cooler stars (bigger CIs) are on the right hand side.