When I think about mapping new places, I remember Vincent Van Gogh, who once said “To look at the stars always makes me dream, as simply as I dream over the black dots of a map representing towns and villages. Why, I ask myself, should the shining dots of the sky not be as accessible as the black dots on the map of France?”
Why not indeed? The exciting process of mapping new worlds continues to take place as we pursue our reconnaissance of the Solar System, now pushing well into the Kuiper Belt. Mapping Saturn’s giant moon Titan is particularly satisfying, because as you’ll recall, Voyager 1 was diverted from its original trajectory because Titan was just too interesting a target to miss. No Titan mapping then, though we did have useful scientific results, because Voyager 1 saw a world shrouded in orange smog. Cassini changed the game, of course, and now we’re looking deep beneath the clouds.

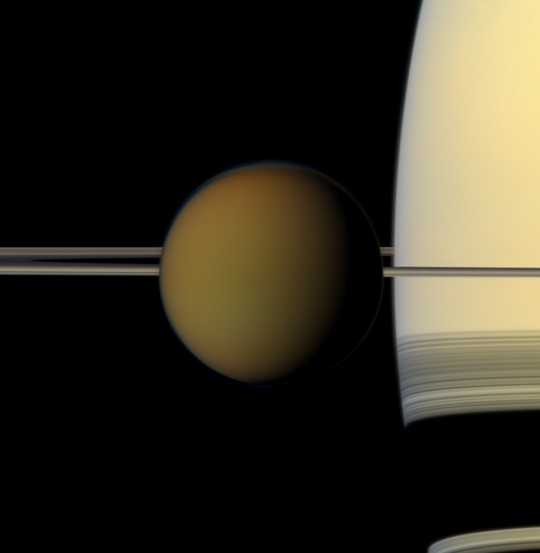
Image: The colorful globe of Saturn’s largest moon, Titan, passes in front of the planet and its rings in this true color snapshot from NASA’s Cassini spacecraft. The north polar hood can be seen on Titan (5,150 kilometers across) and appears as a detached layer at the top of the moon here. This view looks toward the northern, sunlit side of the rings from just above the ring plane. Images taken using red, green and blue spectral filters were combined to create this natural color view. The images were obtained with the Cassini spacecraft narrow-angle camera on May 21, 2011, at a distance of approximately 2.3 million kilometers from Titan. Image scale is 14 kilometers per pixel on Titan. Credit: NASA/JPL-Caltech/Space Science Institute.
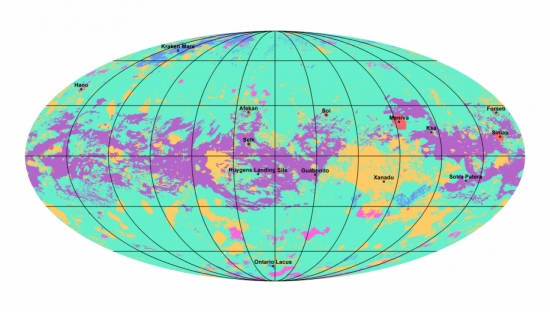
Cassini made something like 120 flybys of Titan in the course of its long campaign at Saturn between 2004 and 2017, using its radar imager to penetrate the atmosphere of nitrogen and methane, while supplementing these views with data from visible and infrared instruments that could make out the larger geological features of the Mercury-sized world. Now Rosaly Lopes (JPL) has led a team of researchers in producing the first map that shows Titan’s global geology, pulling together all of these data to reveal a wide range of terrains. Says Lopes:
“This study is an example of using combined data sets and instruments. Although we did not have global coverage with synthetic aperture radar (SAR), we used data from other instruments and other modes from radar to correlate characteristics of the different terrain units, so we could infer what the terrains are even in areas where we don’t have SAR coverage.”
Image: The first global geological map of Saturn’s largest moon, Titan, is based on radar and visible and infrared images from NASA’s Cassini mission, which orbited Saturn from 2004 to 2017. Labels point to several of the named surface features. Also located is the landing site of the European Space Agency’s Huygens Probe, part of NASA’s Cassini mission. Credit: NASA/JPL-CalTech/ASU.
When we turn Titan into a map, we begin to sense how many features on the surface resemble similar features on Earth, evidencing similar geological processes at work, with methane/ethane being the operative fluid here. We’re seeing a hydrologic cycle active on a surface rich in hydrocarbon rain, a place segmented by rivers and punctuated by lakes and seas. It’s interesting to see, by the way, that David Williams (Arizona State), who was a major player in extrapolating radar images into areas not covered by radar, is also the man who will make the first global geologic map of (16) Psyche on a mission scheduled for a 2022 launch. For more on that one, see Psyche Mission Moved Up, a 2017 Centauri Dreams article.
The paper is Lopes et al., “A global geomorphologic map of Saturn’s moon Titan,” Nature Astronomy 18 November 2019 (abstract).


FYI: It is now OFFICIAL(i.e., not JUST “official”) – water plumes ARE erupting from the surface of Europa! A planetary science team using Keck has DIRECTLY DETECTED water vapor above the surface of the Jovian moon for the first time. Surprisingly, there are signifigant fluctuations in the LEVEL of water vapor observed at different times, implying that unlike Enceladus, plume activity is not continuous, but instead, quite SPORADIC!
Not being critical, but why would you be surprised by sporadic plume activity Harry? Here, even Old Faithful is sporadic in timing and volume.
The lakes look so small on this map! I’d love to see a polar projection of the northern hemisphere to put them into focus.
I don’t see this on ArXiv, but at least the map key can be viewed at https://manyworlds.space/2019/11/18/mapping-titan-the-most-earth-like-body-in-our-solar-system/ . What strikes me about this map is how different it looks from Earth. Our planet sports a tremendous randomness: a hemisphere of nearly all ocean, a hemisphere of mostly land, one pole land and one sea in the opposite pattern, long plate boundaries with tall mountains on one side and deep trenches on the other. Titan’s map looks like a function of latitude … with the exception of craters, of course, and the “hummocky” parts such as Xanadu, more surprisingly.
The latitude influence on features is very noticeable. This must be telling us something about the geology and forces acting on Titan’s surface.
Much of the difference is that Titan has been found to be lacking in plate tectonics ( https://www.sciencedaily.com/releases/2017/05/170518143817.htm ) – so no “Ring of Fire” mountain ranges, no grand supercontinent cycle to concentrate high terrain in one place and split it up again. NASA reports “tectonics” of a sort ( https://www.nasa.gov/mission_pages/cassini/multimedia/pia10654.html ) but I would assume this is much more limited in global effect.
I like the feature when you click the color code map of Titan with the mouse arrow it becomes large and the meaning of the color codes are explained, e.i., blue areas correspond to lakes of CH4