We just looked at how gravitational microlensing can be used to analyze the mass of a star, giving us a method beyond the mass-luminosity relationship to make the call. And we’re going to be hearing a lot more about microlensing, especially in exoplanet research, as we move into the era of the Nancy Grace Roman Space Telescope (formerly WFIRST), which is scheduled to launch in 2027. A major goal for the instrument is the expected discovery of exoplanets by the thousands using microlensing. That’s quite a jump – I believe the current number is less than 100.
For while radial velocity and transit methods have served us well in establishing a catalog of exoplanets that now tops 5000, gravitational microlensing has advantages over both. When a stellar system occludes a background star, the lensing of the latter’s light can tell us much about the planets that orbit the foreground object. Whereas radial velocity and transits work best when a planet is in an orbit close to its star, microlensing can detect planets in orbits equivalent to the gas giants in our system.

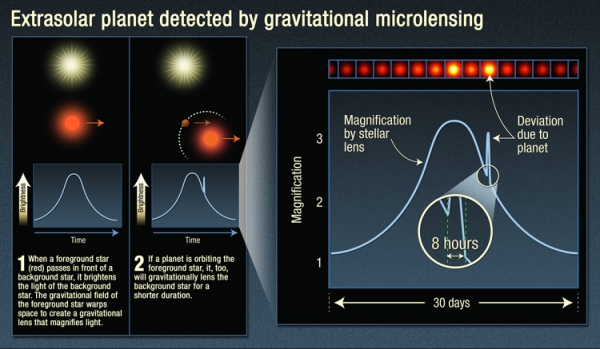
Image: This infographic explains the light curve astronomers detect when viewing a microlensing event, and the signature of an exoplanet: an additional uptick in brightness when the exoplanet lenses the background star. Credit: NASA / ESA / K. Sahu / STScI).
Moreover, we can use the technique to detect lower-mass planets in such orbits, planets far enough, for example, from a G-class star to be in its habitable zone, and small enough that the radial velocity signature would be tricky to tease out of the data. Not to mention the fact that microlensing opens up vast new areas for searching. Consider: TESS deliberately works with targets nearby, in the range of 100 light years. Kepler’s stars averaged about 1000 light years. Microlensing as planned for the Roman instrument will track stars, 200 million of them, at distances around 10,000 light years away as it looks toward the center of the Milky Way.
So this is a method that lets us see planets at a wide range of orbital distances and in a wide range of sizes. The trick is to work out the mass of both star and planet when doing a microlensing observation, which brings machine learning into the mix. Artificial intelligence algorithms can parse these data to speed the analysis, a major plus when we consider how many events the Roman instrument is likely to detect in its work.
The key is to find the right algorithms, for the analysis is by no means straightforward. Microlensing signals involve the brightening of the light from the background star over time. We can call this a ‘light curve,’ which it is, making sure to distinguish what’s going on here from the transit light curve dips that help identify exoplanets with that method. With microlensing, we are seeing light bent by the gravity of the foreground star, so that we observe brightening, but also splitting of the light, perhaps into various point sources, or even distorting its shape into what is called an Einstein ring, named of course after the work the great physicist did in 1936 in identifying the phenomenon. More broadly, microlensing is implied by all his work on the curvature of spacetime.
However the light presents itself, untangling what is actually present at the foreground object is complicated because more than one planetary orbit can explain the result. Astronomers refer to such solutions as degeneracies, a term I most often see used in quantum mechanics, where it refers to the fact that multiple quantum states can emerge with the same energy, as happens, for example, when an electron orbits one or the other way around a nucleus. How to untangle what is happening?
A new paper in Nature Astronomy moves the ball forward. It describes an AI algorithm developed by graduate student Keming Zhang at UC-Berkeley, one that presents what the researchers involved consider a broader theory that incorporates how such degeneracies emerge. Here is the university’s Joshua Bloom, in a blog post from last December, when the paper was first posted to the arXiv site:
“A machine learning inference algorithm we previously developed led us to discover something new and fundamental about the equations that govern the general relativistic effect of light- bending by two massive bodies… Furthermore, we found that the new degeneracy better explains some of the subtle yet pervasive inconsistencies seen [in] real events from the past. This discovery was hiding in plain sight. We suggest that our method can be used to study other degeneracies in systems where inverse-problem inference is intractable computationally.”
What an intriguing result. The AI work grows out of a two-year effort to analyze microlensing data more swiftly, allowing the fast determination of the mass of planet and star in a microlensing event, as well as the separation between the two. We’re dealing with not one but two brightness peaks in the brightness of the background star, and trying to deduce from this an orbital configuration that produced the signal. Thus far, the different solutions produced by such degeneracies have been ambiguous.

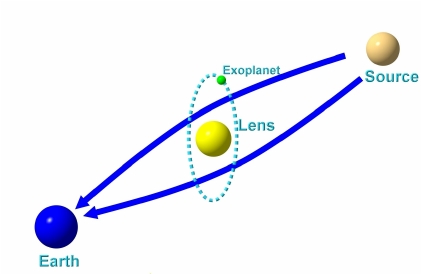
Image: Seen from Earth (left), a planetary system moving in front of a background star (source, right) distorts the light from that star, making it brighten as much as 10 or 100 times. Because both the star and exoplanet in the system bend the light from the background star, the masses and orbital parameters of the system can be ambiguous. An AI algorithm developed by UC Berkeley astronomers got around that problem, but it also pointed out errors in how astronomers have been interpreting the mathematics of gravitational microlensing. Credit: Research Gate.
Zhang and his fellow researchers applied microlensing data from a wide variety of orbital configurations to run the new AI algorithm through its paces. Let’s hear from Zhang himself:
“The two previous theories of degeneracy deal with cases where the background star appears to pass close to the foreground star or the foreground planet. The AI algorithm showed us hundreds of examples from not only these two cases, but also situations where the star doesn’t pass close to either the star or planet and cannot be explained by either previous theory. That was key to us proposing the new unifying theory.”
Thus to existing known degeneracies labeled ‘close-wide’ and ‘inner-outer,’ Zhang’s work adds the discovery of what the team calls an ‘offset’ degeneracy. An underlying order emerges, as the paper notes, from the offset degeneracy. In the passage from the paper below, a ‘caustic’ defines the boundary of the curved light signal. Italics mine:
…the offset degeneracy concerns a magnification-matching behaviour on the lens-axis and is formulated independent of caustics. This offset degeneracy unifies the close-wide and inner-outer degeneracies, generalises to resonant topologies, and upon re- analysis, not only appears ubiquitous in previously published planetary events with 2-fold degenerate solutions, but also resolves prior inconsistencies. Our analysis demonstrates that degenerate caustics do not strictly result in degenerate magnifications and that the commonly invoked close-wide degeneracy essentially never arises in actual events. Moreover, it is shown that parameters in offset degenerate configurations are related by a simple expression. This suggests the existence of a deeper symmetry in the equations governing 2-body lenses than previously recognised.
The math in this paper is well beyond my pay grade, but what’s important to note about the passage above is the emergence of a broad pattern that will be used to speed the analysis of microlensing lightcurves for future space-and ground-based observations. The algorithm provides a fit to the data from previous papers better than prior methods of untangling the degeneracies, but it took the power of machine learning to work this out.
It’s also noteworthy that this work delves deeply into the mathematics of general relativity to explore microlensing situations where stellar systems include more than one exoplanet, which could involve many of them. And it turns out that observations from both Earth and the Roman telescope – two vantage points – will make the determination of orbits and masses a good deal more accurate. We can expect great things from Roman.
The paper is Zhang et al., “A ubiquitous unifying degeneracy in two-body microlensing systems,” Nature Astronomy 23 May 2022 (abstract / preprint).


Given the distances and relative velocities of the 2 stars (most distant source and closer star with exoplanets), could many telescopes in space, using the maximum baseline of the orbit of Neptune (60 AU) return multiple lensing encounters to improve the data quality and even possibly better characterize the exoplanet[s] orbit?
What would be the benefit, if any, of the same idea, but with the many telesopes positioned in a sphere around Sol at the SGL starting at 550 AU?
Alex, a spherical array of gravitational lens telescopes was the (SPOILER AHEAD) denouement of David Brin’s “Existence.”
I forgot about that.
Will the transits give more than one planet? If an ETI with equivalent telescopes looked at the solar system, would they see just Saturn (say), or Jupiter, Saturn, Uranus and Neptune?
Remember, this is gravitational lensing, not the transit method. And yes, with the right algorithms, more than one planet can be detected in a microlensing event. As to transits, that method would require the planets to be co-planar to a high degree in order to detect several planets in the same system.
Now stellar foci have focal lines right?
Barnard’s Star moves so fast it may pass in front of some known exoworlds and maybe give us a freebie?
Is it due to pass in front of anything f interest in the next few decades?
I’m not aware of any occultations by Barnard’s Star of a known exoplanetary system, I’m afraid.
You have it reversed.
We want the exoplanet to pass in front of the background star. A background exoplanet’s Einstein ring due to a foreground star will almost always be too weak and difficult to extract from the star’s light.
It seems the system to collect and analyse the data could be automated so that only confirmation by humans would be done.
I”m just wondering if there will be 10 times as many M/red dwarf stars caught in microlensing as G type stars and could this give an unbiased view of how many planets are around stars/brown dwarfs from O to Y? Will it be able to see the exoplanets near red dwarfs?
Roman’s microlensing source star population will be mostly G-K-early M stars, but there likely won’t be a significant number of events from late-M and onward. So yes, Roman should measure planets around red dwarf stars down to about 10% of Solar mass / 0.1% of Solar luminosity.
It appears now that planets are extremely common, and probably habitable satellites orbiting those planets as well. Abodes for life appear to be a routine by-product of stellar births, and it appears stars of all types are included.
The major limiting factor is that life demands a stable environment with sufficient time for evolution to develop complex organisms and ecosystems. The major contraindication (for SETI purposes) is that most stars are members of binary systems, and the energetic and rapid evolution of one of a binary’s members would be detrimental to the establishment of life near its more stable, long-lived companion.
The key question we need to consider now is how are the separations between members of binary pairs spatially distributed? If close, and interacting, binary pairs are the rule then the outbursts of the more massive, rapidly evolving member would be catastrophic for biological development on the more sedate companion. On the other hand, if the pair are widely separated, the rapidly evolving member might have little effect on its biologically active sibling. Astronomy tells us both binary types occur, from contact binaries to systems where the distances between the two stars is hundreds, or even thousands of AU.
Has anyone published on this? Are there any theoretical studies or observations that can give us an idea whether close or widely separated binaries are the rule or the exception? I suspect that due to selection effects, close pairs are easier to detect so a perusal of a binary star catalog would probably be biased in favor of close pairs.
Paul, you have an encyclopedic knowledge of the literature and you stay on top of it pretty well; what do you think?
PS. Please note, my email address has changed
I suspect you’re right, Henry, in your thoughts on bias in favor of close pairs, though I can’t recall any recent work on this. I’ll dig around a bit and see what I can find.
The close in binaries are relatively easy to identify as spectroscopic binaries. Double and binaries have been studied since way back and much has been studied by double star observers and large catalogs compiled.
http://www.astro.wisc.edu/~skessler/pics/Wiki_Spect_Binaries_v2.gif
I believe Spectroscopic Binaries are more common.
“Close binary” is a relative term. Two stars may appear very close together just because they are very far away. Angular (apparent) separation has as much to do with the distance between the stars as it has to do with the distance of the pair from us. It also has to do with how fast the two are orbiting each other, and how far apart they are intrinsically, in AU. It also depends on WHEN you happen to be looking at them. These are, after all, moving objects. Some binaries have been continuously observed for over a century, but they are so far apart not enough time has elapsed for us to be able to figure out their orbital elements. We may have seen only a small fraction of their orbit.
Spectroscopic binary measurements depend on the velocity of the two stars around each other, not their closeness, although there is some correlation between the two; and the measurements are tedious and difficult (not to mention highly dependent on the inclination of the system to the line-of-sight). The catalogs are filled with old filar micrometer observations by visual observers, because these are the easiest to detect . The old timers did great work, but they had little in the way of modern tech or computation. But theyalso tend to be long-period systems. Then there are the ‘suspected’ binaries, which are often so far from their primaries that only proper motion studies hint at their nature.
You can’t really tell by looking at a double star catalog how real separations are statistically distributed. (And of course, there are often huge error bars associated with this legacy data!) We may have information about angular separations, periods, and orbital inclinations, even orbital elements and masses, but without accurate parallaxes for these systems its hard to even say whether the typical binary is close or distant. We certainly don’t have anything like a “Real Separation Function” that might give us some insight into the formation of complex systems. Do planets help disperse excess angular momentum in circumstellar disks around protostars? No doubt an RSF would give us real insight into the formation of these systems, and of any planets associated with them. Any theory of planetary/stellar formation would have to explain the observed RSF curve.
Hopefully, the quality parallaxes we are now getting from the new generation of astrometric satellites may go a long way to helping resolve these issues. Still, this is all traditional astronomy. The big money and talent and technology is all going into astrophysics these days. Yes, even in science, academic fashion plays a big role.
I would like to think that modern interest in astrobiology might inspire more contemporary research into these areas.
It does depend on how close the two stars are in a spectroscopic binary. The stars are either two close together to differentiate them , so in visible light they are seen as one or the binary is too far away to differentiate them. They are know as spectroscopic binaries only because we can’t differentiate them, but we can see two sets of spectral lines, the spectra are split or doubled, one for each star which is why they are called spectral binaries and not visible binaries. The radial velocity does matter for the red shift and blue shift where the higher frequency causes the lines to appear apart or separate. https://www.atnf.csiro.au/outreach/education/senior/astrophysics/binary_types.html
Where Are All of the Small Planets?
Are super-Earth and mini-Neptune planets really the most common type of exoplanet in the Universe?
Right now, based on multiple search techniques including microlensing surveys, transit surveys, and RV surveys it appears that planets in the super-Earth and mini-Neptune category are more common than planets the mass of Earth and sub-Earth mass planets. This runs counter to what we might expect given that, for example, there are more small boulders than large boulders and there are more grains of sand than there are small boulders, etc. There are more small comets than there are large comets and there are more small asteroids than there are asteroids capable of bringing about an extinction level event.
Additional Questions:
1. Are there any theoretical expectations as to why planet formation would be any different from other processes that tend to favor the formation of more smaller objects than larger objects of a given class of object?
2. How likely is that in actuality Earth mass and sub-Earth mass planets are actually more common than super-Earth and mini-Neptune sized planets, but our current instrumentation is not sensitive enough to probe the lower end of the exoplanet mass distribution?
3. Will the Nancy Grace Roman Space Telescope and other future exoplanet search instruments be able to probe the lower end of the mass distribution with sufficient sensitive to answer the above questions?
There are probably a lot more small ‘whatevers’ than there are big ‘uns.
The problem is that the big ‘uns are easier to spot. This is a problem astronomers are always on the lookout for, since it is a completely observational science; when you survey any population, the relative numbers of the most detectable ones are more numerous, even though they may actually be the rarest of all. Its called a “selection effect’.
For example, the most common type of star by far is the faint red dwarf, they make up about 3/4 of all stars. Yet, when you go out under a clear night you can’t even see one, even though many are relatively close by. All the stars you see with the naked eye are actually much brighter but which can be seen at much greater distances.
Unfortunately, most astronomical techniques are affected by the selection effect, and even folks who are well aware of it tend to forget it and form an instinctive picture of the universe that is highly biased.
Thank you, Henry. I had wondered about a “selection effect” explanation for the dearth of small terrestrial exoplanet discoveries relative to the abundance of super-Earth and mini-Neptune exoplanet discoveries, and it does make sense. It makes sense especially in light of the history of exoplanet science starting in the 1990s when hot-Jupiter exoplanets were the only exoplanets being discovered whereas fast-forward to 2022, we now recognize how hot-Jupiter exoplanets are significantly less common than, say, mini-Neptune exoplanets. That said, I vaguely remember hearing that the observed distribution may be more or less reflective of the actual exoplanet mass distribution in which case super-Earth exoplanets are indeed more common than Earth-sized or smaller exoplanets. My hope is that future instrumentation can help us determine whether the selection effect hypothesis is true (or not).
Hey, Mr Spaceman…
Sorry, I can’t resist a nod to a favorite old Byrds tune…
https://genius.com/The-byrds-mr-spaceman-lyrics
“Woke up this morning with light in my eyes
And then realized it was still dark outside
It was a light comin’ down from the sky
I don’t know who or why
Must be those strangers that come every night
Whose saucers shaped lights put people up tight
Leave blue green footprints that glow in the dark
I hope they get home all right
Hey Mr. Spaceman, won’t you please take me along
I won’t do anything wrong
Hey Mr. Spaceman, won’t you please take me along
For a ride
Woke up this mornin’, I was feeling quite weird
Had flies in my beard, my toothpaste was smeared
Over my window, they’d written my name
Said: “So long, we’ll see you again”
Yes, it seems that our planetary detection techniques tend to work better with big worlds in eccentric orbits close to small stars, so our discoveries are biased accordingly. I also suspect the mass function for planets, as well as the semi-major axes of their orbits, may also be a function of the mass of the star they orbit. Besides the utility for SETI researches, this mass and orbit distribution probably will reveal much about the star and planet forming process. Surely, the nature of star formation must leave its imprint on the layout of systems left orbiting these stars.
In any case, our current catalog of exoplanets may be skewed more to reflect our observational techniques than the actual properties of these worlds themselves. In spite of what the data suggests now, I suspect there is no shortage of other earths out there.
This is probably addressed in the primary research, but I thought I would ask whether the radius of the lensing exoplanet can also be determined from the light curve.
In the imaginary example in the graphic provided, the star lenses for 90 times as long as the planet. Would this imply an exoplanet radius 1/90th of the stellar radius (which can be computed from its luminosity and temperature)? Or is this time difference dependent on the relative masses? Or some combination of the two?
Some interesting new developments;
Astronomers Have Found a Super-Earth Near The Habitable Zone of Its Star.
https://www.sciencealert.com/a-super-earth-has-been-found-near-the-habitable-zone-of-a-star-in-the-solar-neighborhood
What is interesting is it was discovered by RV but several articles say it was also detected by transit with TESS!
Also two new techniques that may make planet wide optical quantum telescopes feasible.
A new Quantum Technique Could Enable Telescopes the Size of Planet Earth.
https://www.universetoday.com/155841/a-new-quantum-technique-could-enable-telescopes-the-size-of-planet-earth/
Teleportation breakthrough paves the way for quantum internet.
https://www.msn.com/en-us/news/technology/teleportation-breakthrough-paves-the-way-for-quantum-internet/ar-AAXLwKb
Fascinating development! Looking at the linked Arxiv paper ( https://arxiv.org/pdf/2204.06044.pdf ), I’m taking that this is some real science, as in real tough science, involving a STIRAP signal that somehow transmits the phase information for visible light VLBI without having to measure it.
Let’s veer SETI a minute. What strikes me is that visible VLBI is something of a bandwidth problem – you’d need 10E5 more data than some very high bandwidth connections between radio telescopes people rely on now. Does this mean STIRAP is a much more efficient way of sending information? Is that something we can look for? Can we distinguish it from noise?
Suppose we have a “Lurker” in our system, which is part of a VLBI telescope with an effective aperture the size of the Milky Way galaxy. If it is using this mode of communication to compare data received from other stars, is it conceivable to tap into what seemed like white noise sources, match up the phases from those points, and reconstruct the image?